Chatsight
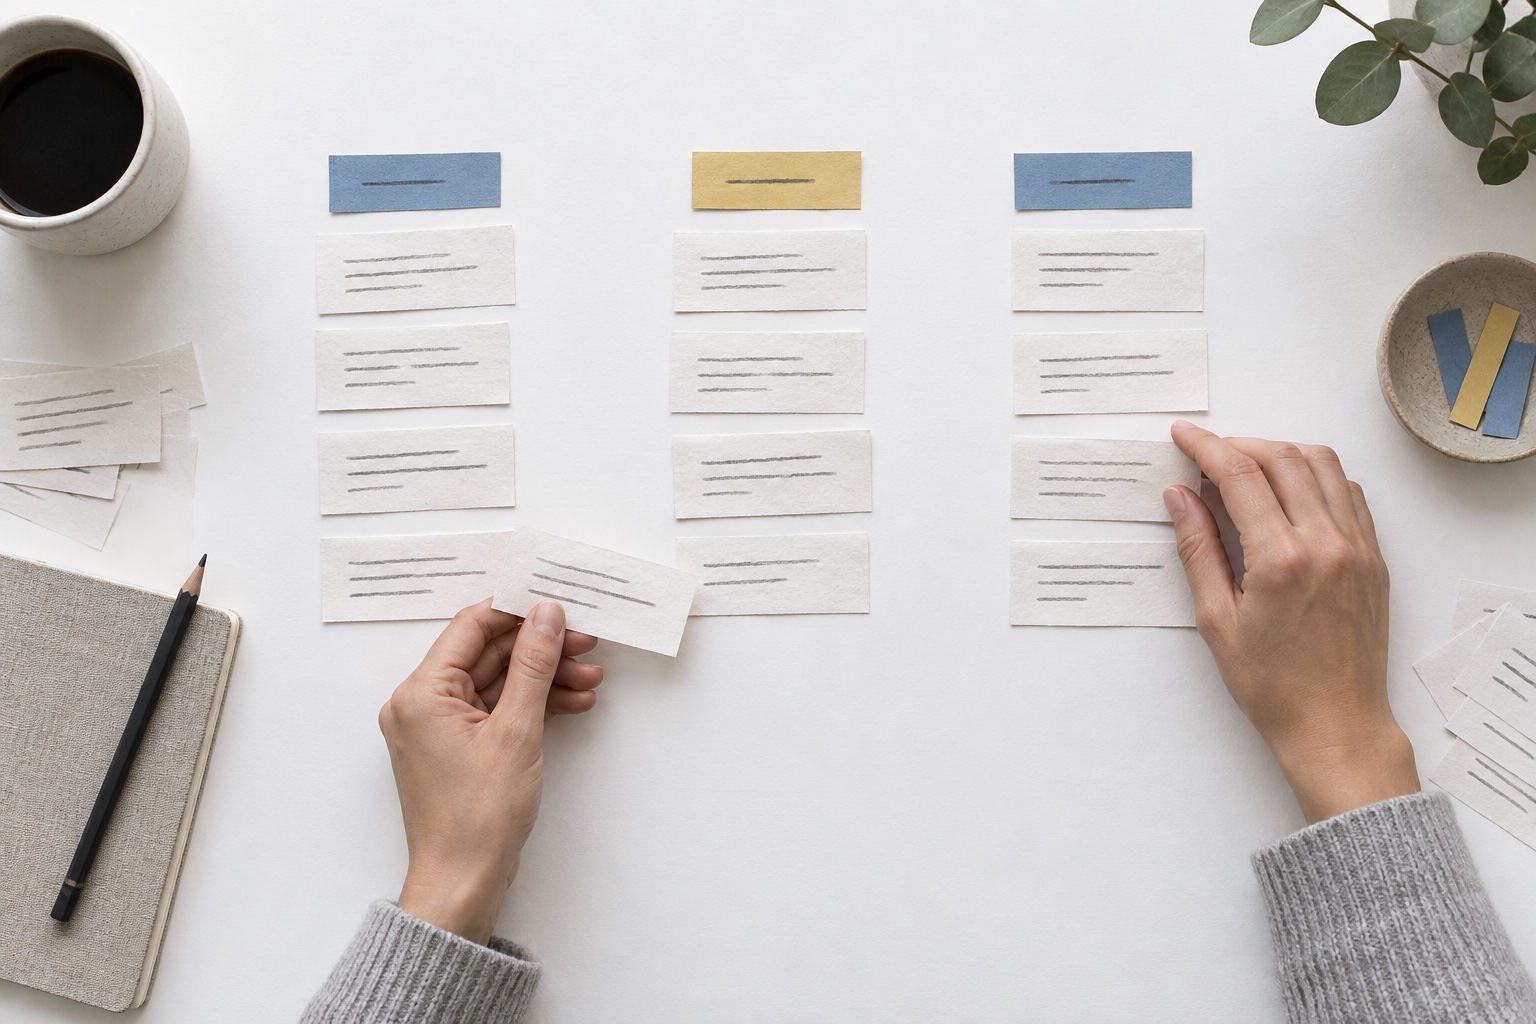
A research tool for instructors reviewing student–AI conversations. Instructors develop categories as they read, then review AI-assisted labels while keeping control of the process.
Project lead at UC San Diego’s dstl lab.
Research, teaching tools, and interactive data stories.
A research tool for instructors reviewing student–AI conversations. Instructors develop categories as they read, then review AI-assisted labels while keeping control of the process.
Project lead at UC San Diego’s dstl lab.
Select a label to explore how a short message can hold more than one meaning.
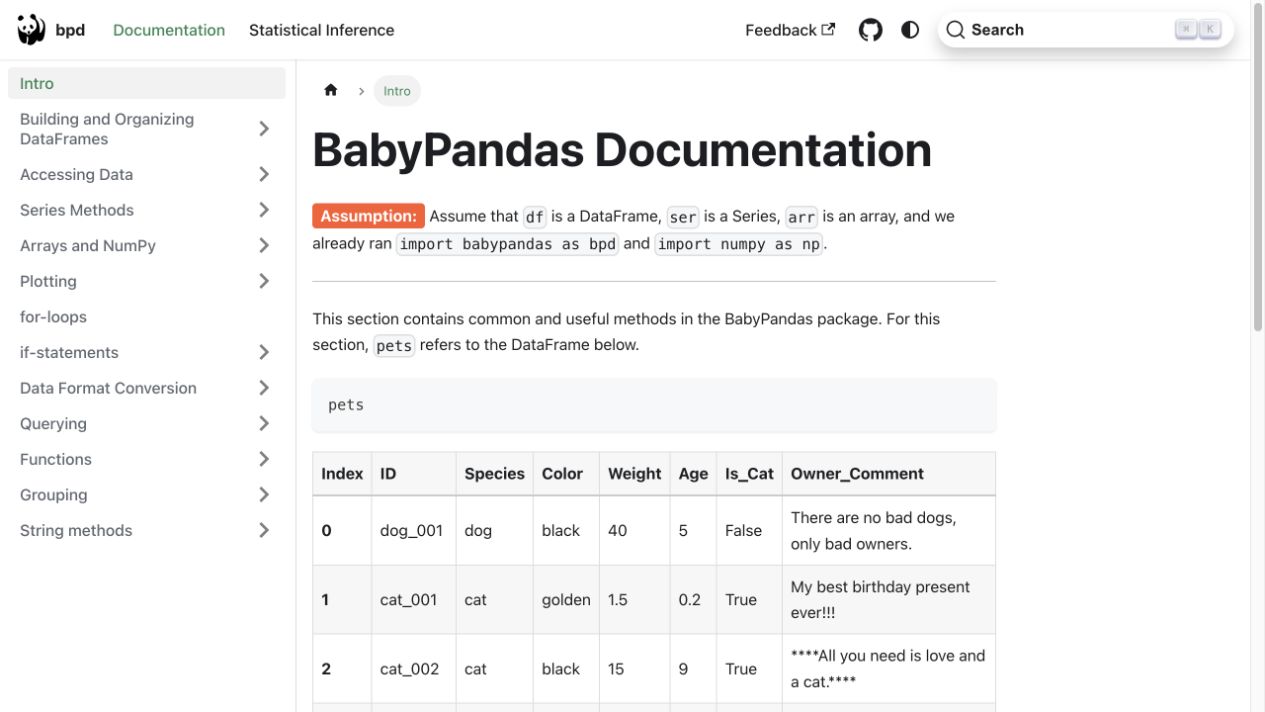
A reference and documentation site for students learning data science with BabyPandas. Examples cover working with DataFrames, plotting, and statistical inference.
Built for UCSD’s DSC 10 course.
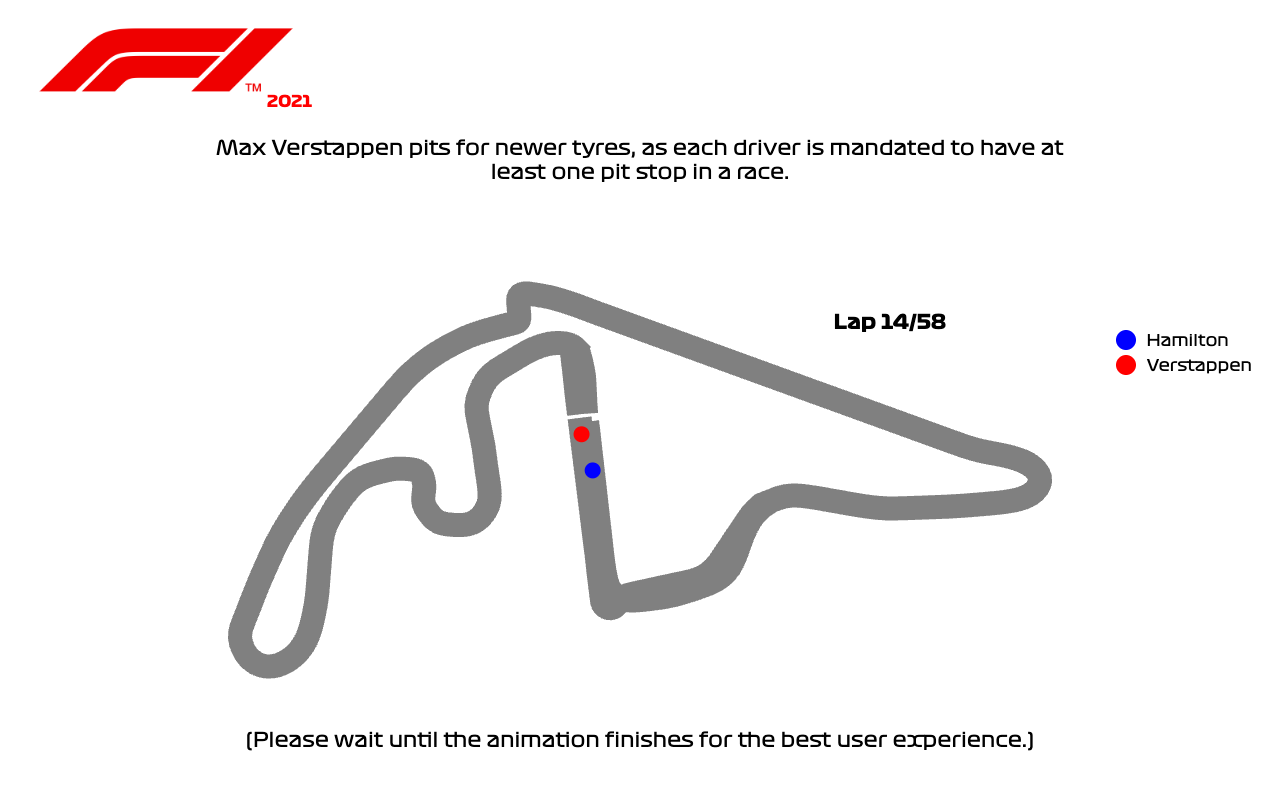
An interactive story explaining Formula 1 and the controversial end to the 2021 season. Scrolling introduces the sport and walks readers through the final race.
Created with David Moon.
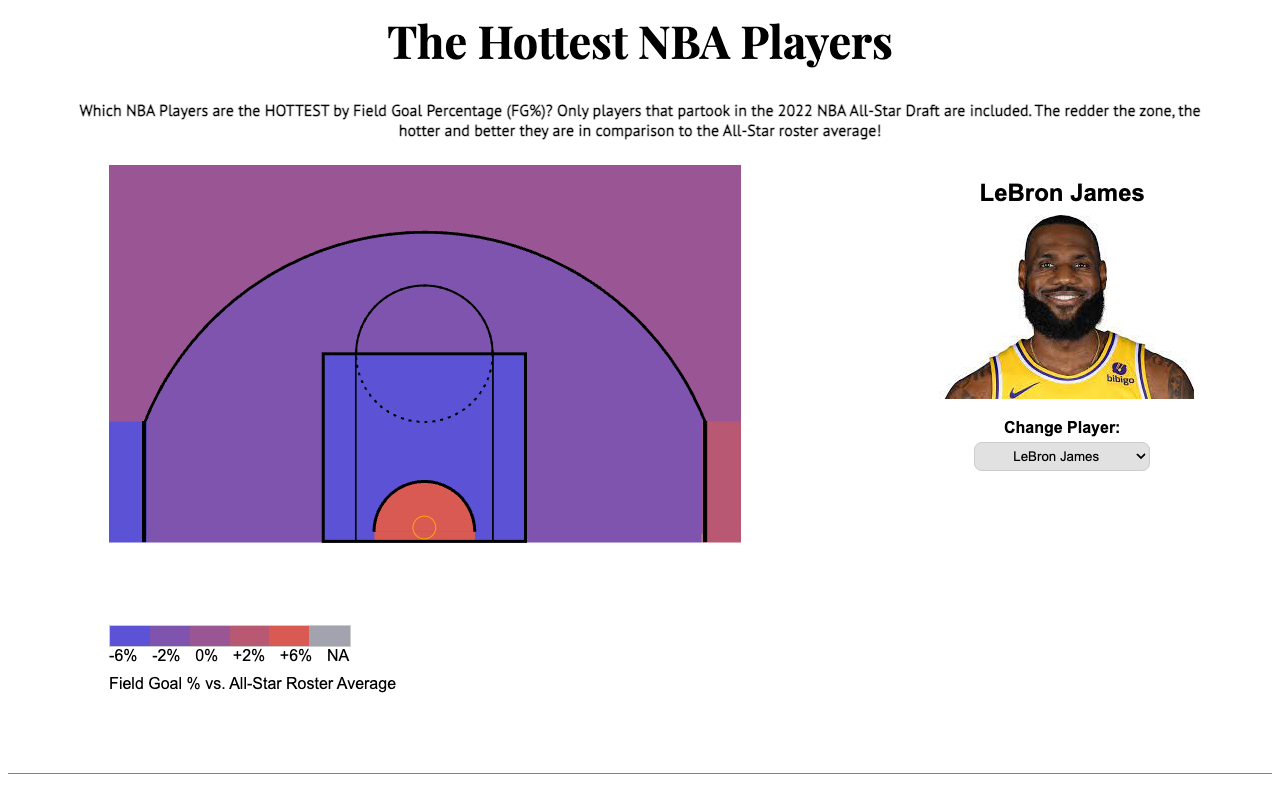
An interactive look at shooting efficiency across court zones. Explore where NBA All-Stars shoot most effectively using a color-coded court visualization.
I led the data preparation and final design decisions. Created with David Moon and Jason Kim.
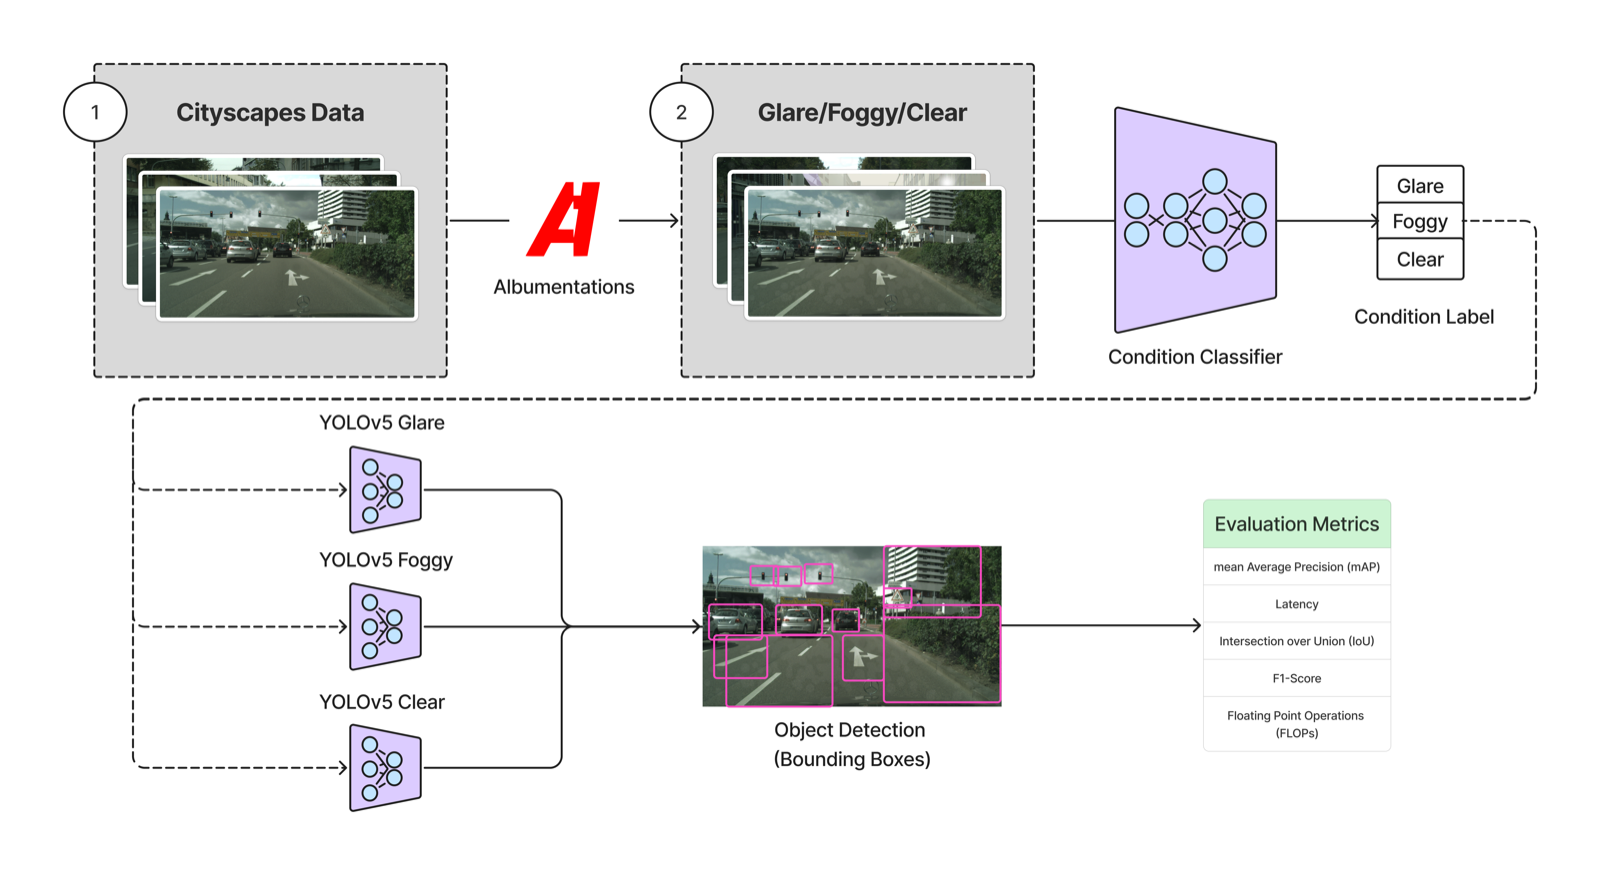
A computer vision project exploring object detection in fog and glare. A lightweight condition classifier routes images to specialized detection models for different environments.
Created with Andy Ho.